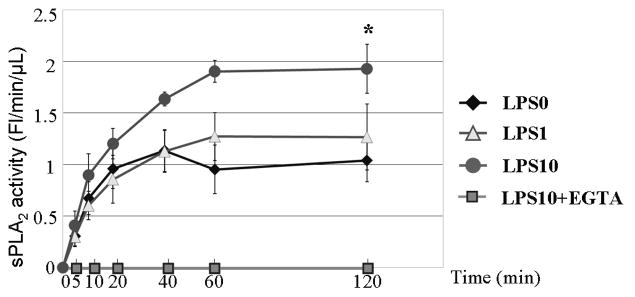
Figure 1. sPLA2 release following LPS Stimulation of Intestinal Segments.

Figure 1A Kinetics of sPLA2 activity (FL/min/μL) in culture media following LPS stimulation at LPS doses of 0 (LPS0), 1 (LPS1), and 10 μg/mL (LPS10). sPLA2 activity reached a plateau at 60 minutes and remained constant through 120 minutes. At 120 minutes LPS10 was significantly greater than LPS0 but failed to reach significance vs LPS1. LPS1 did not significantly differ from LPS0. * p<0.05 vs. LPS0
Figure 1B Representative sPLA2-IIA western blot of tissue culture media after LPS stimulation. LPS0 and LPS1 did no differ, while LPS10 showed an increase in sPLA2-IIA concentration consistent with the observed activity. Bands are 14 kDa molecular weight.

