
Figure 2.
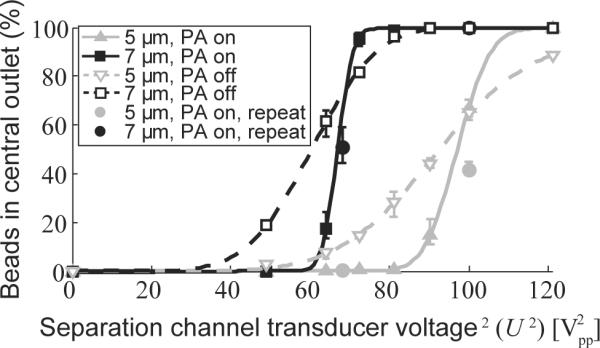
Acoustophoretic separation of microbeads. Graph showing the proportion of 5 μm beads (gray) and 7 μm beads (black) collected in the central outlet, compared to the total number of beads collected, as a function of U2, the piezoceramic transducer voltage squared. (U2 is linearly proportional to the acoustic energy density and thus also the acoustic velocity of the beads.) Experiments were performed with acoustophoresis pre-alignment (PA) on (filled symbols) or off (open symbols). Measurements were repeated at two of the voltages on a later occasion (filled circles). The lines represent fits of a cumulative distribution function to the experimental data (see Supplementary Note 1). The values given are means, the error bars denoting min and max values (n=3).