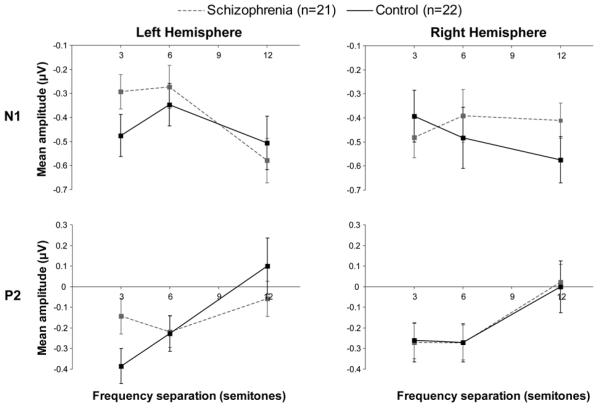
Figure 4.
(A) Event-related potential (ERP) results. Graph representation of the data presented in Figure 3 for the N1 and P2 ERPs separated by hemisphere. The effect of Δf was smaller in the schizophrenia group in the right hemisphere for the N1 (p<.02) and smaller in the left hemisphere for P2 (p<.05). Data for the N1 are mean amplitudes 80-150 ms after the B tone. Data for the P2 are mean amplitudes 200-280 ms after the B tone. Note the different mean amplitude scales for each component. Left hemisphere includes FC3 and C3 electrodes. Right hemisphere includes FC4 and C4 electrodes. Error bars represent ±1 SE. (B) Topographies of difference waves for ERPs elicited when Δf is 12-3 semitones. Isopotential contours reflect 0.05 μV/step.

