
Figure 2.
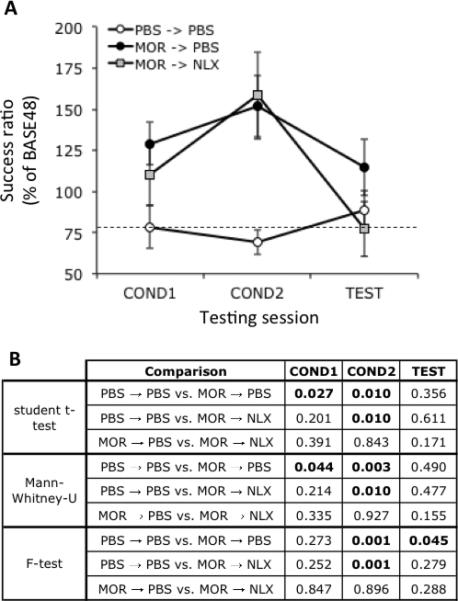
(A) Mean operant licking responses for palatable reward under various drug treatment conditions as described in fig. 1B. Dashed line indicates responding in the PBS→PBS-treated group during COND1 as a point of reference. Data is expressed as responses normalized to mean responding during BASE48 as depicted in fig. 1A within each treatment groups. Data is expressed as mean ± S.E.M. Group sizes (n): PBS→PBS, 8; MOR→PBS, 19; MOR→NLX, 10. (B) p values for t-test, Mann Whitney-U and F-test comparisons for responses at all time points shown in A. p values (t-test or F-test) less than 0.05 are bolded.