Figure 5.

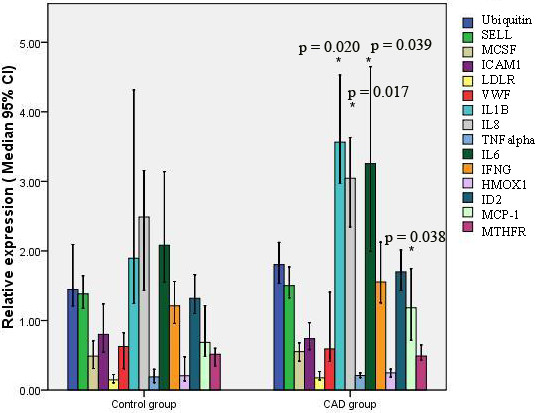
Relative expression of 15 CAD-related genes in the CAD group and control group. Data were normalized to ACTB and GK. Compared with control group, *P < 0.05.

Relative expression of 15 CAD-related genes in the CAD group and control group. Data were normalized to ACTB and GK. Compared with control group, *P < 0.05.