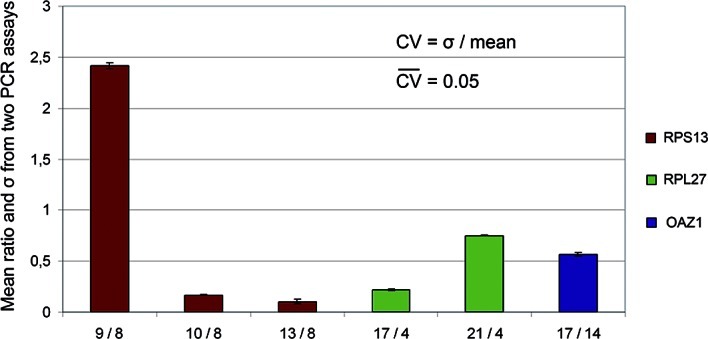
Figure 1.

Chart of the mean and σ between two PCR runs. Four samples (8, 9, 10 and 13) amplified with RPS13 primers (red) showed a σ > 0.3 in the first run and were therefore re-run a second time. Ratios were calculated by dividing all samples by one arbitrary sample from the same PCR run, and means between the two runs were calculated for each ratio. The CV was then calculated by dividing the σ-value by the mean. The same was performed for RPL27 (three samples, 4, 17 and 21) and OAZ1 (two samples, 17 and 14). All Ct-values were transformed to relative quantities before calculations.
