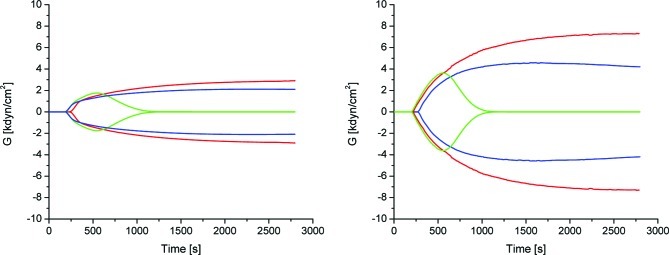
Figure 1.
Clotting was induced by addition of CaCl2. (A) Thromboelastogram of the patient. Blood: red, control; green, blood treated with tPA; blue, blood treated with tPA and PAI-1. (B) For comparison a thromboelastogram of blood from an individual not affected with the PAI-1 deficiency is shown. Red, control; green, blood treated with tPA; blue, treated with tPA andPAI-1.

