
Figure 3.

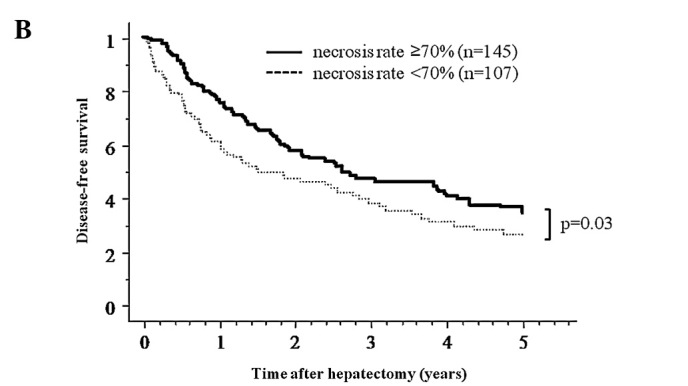
(A) Overall survival curve for the pre-operative TACE group according to the necrosis rate induced by TACE. (B) The 5-year overall and disease-free survival for necrosis rate ≥70% was better than that for necrosis rate <70% (p=0.02).
Official websites use .gov
A
.gov website belongs to an official
government organization in the United States.
Secure .gov websites use HTTPS
A lock (
) or https:// means you've safely
connected to the .gov website. Share sensitive
information only on official, secure websites.
(A) Overall survival curve for the pre-operative TACE group according to the necrosis rate induced by TACE. (B) The 5-year overall and disease-free survival for necrosis rate ≥70% was better than that for necrosis rate <70% (p=0.02).