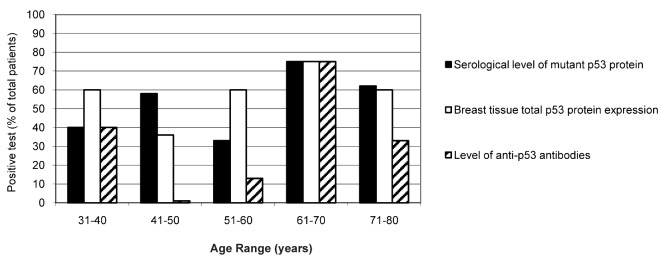
Figure 1.
Age-dependent p53 analysis in breast cancer patients. The graph represents age-dependent p53 expression in the different assays performed. Black columns indicate the percent of patients expressing mutant p53 protein in serum with respect to the total number of patients. White columns represent the percent of positive cases expressing p53 protein in breast tissue by IHC. The hatched columns represent the percent of positive cases demonstrating the presence of anti-p53 antibodies in serum samples.

