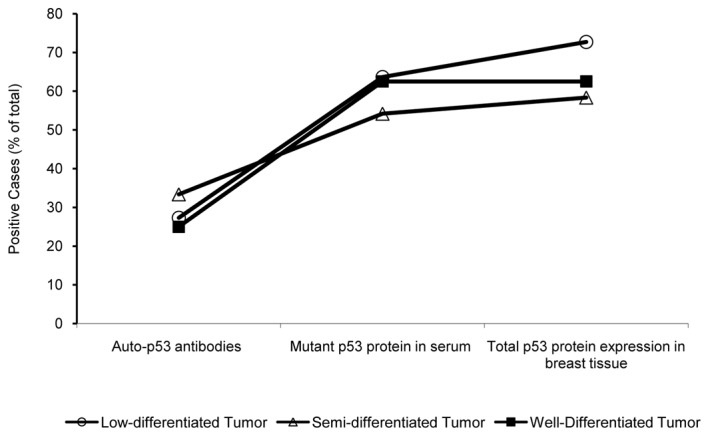
Figure 3.

p53 expression and tumor differentiation-dependent curve in breast cancer patients. The graph shows the percent of positive cases detected in all the assays at different grades of tumor differentiation: poor, semi- and well-differentiated. The level of anti-p53 antibodies, mutant p53 protein in serum and expression of total p53 protein in breast tissues by IHC is indicated. Open circles, poor or low differentiated; black squares, semi-differentiated; open triangles, well-differentiated breast carcinomas.
