
Figure 2.
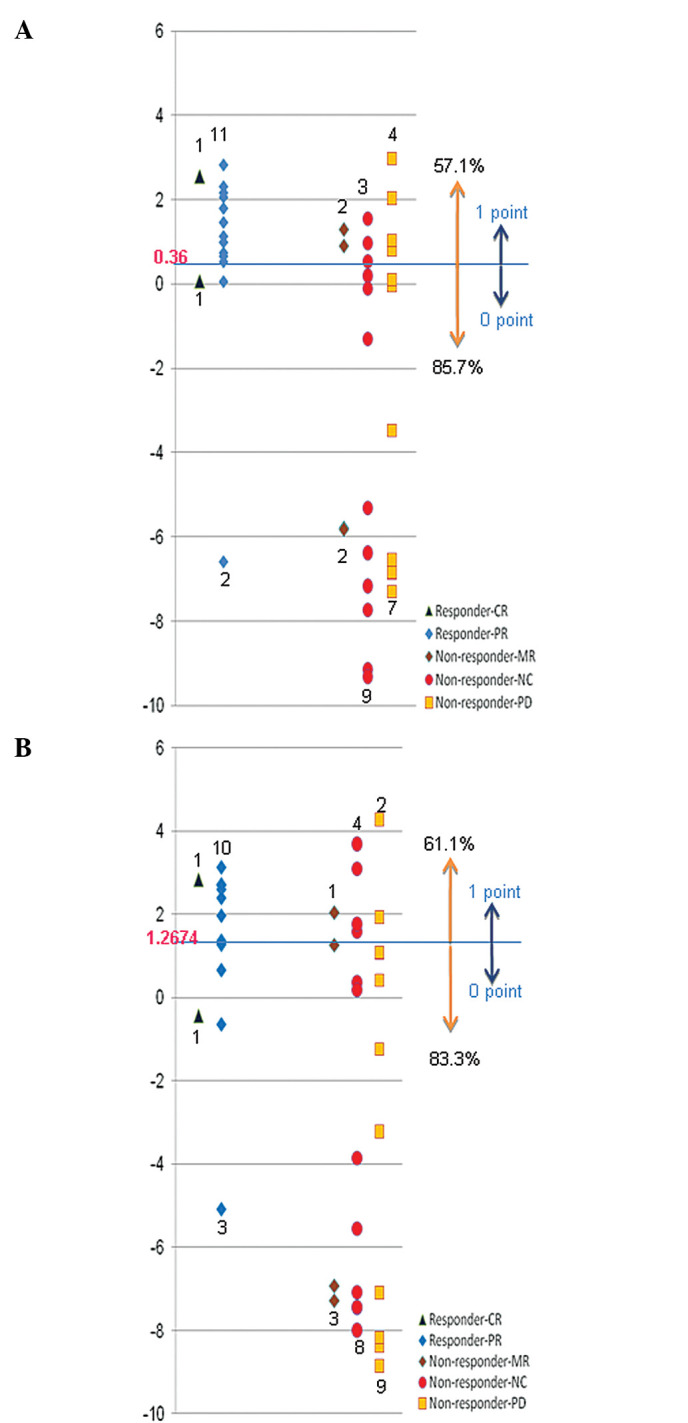
Expression pattern. The figures of the spindle show the value, which was divided by the expression level of the normal tissue and transformed to a logarithm. Dark blue squares, CR; blue diamonds, PR; brown diamonds, MR; red circles, NC; orange squares, PD. Samples whose expression levels were higher than these cutoff values were assigned a score of ‘1’ and samples whose expression levels were lower than these cutoff values were assigned a score of ‘0’. (A) Expression pattern of HLA-DQA1. (B) Expression of HLA-DQB1.