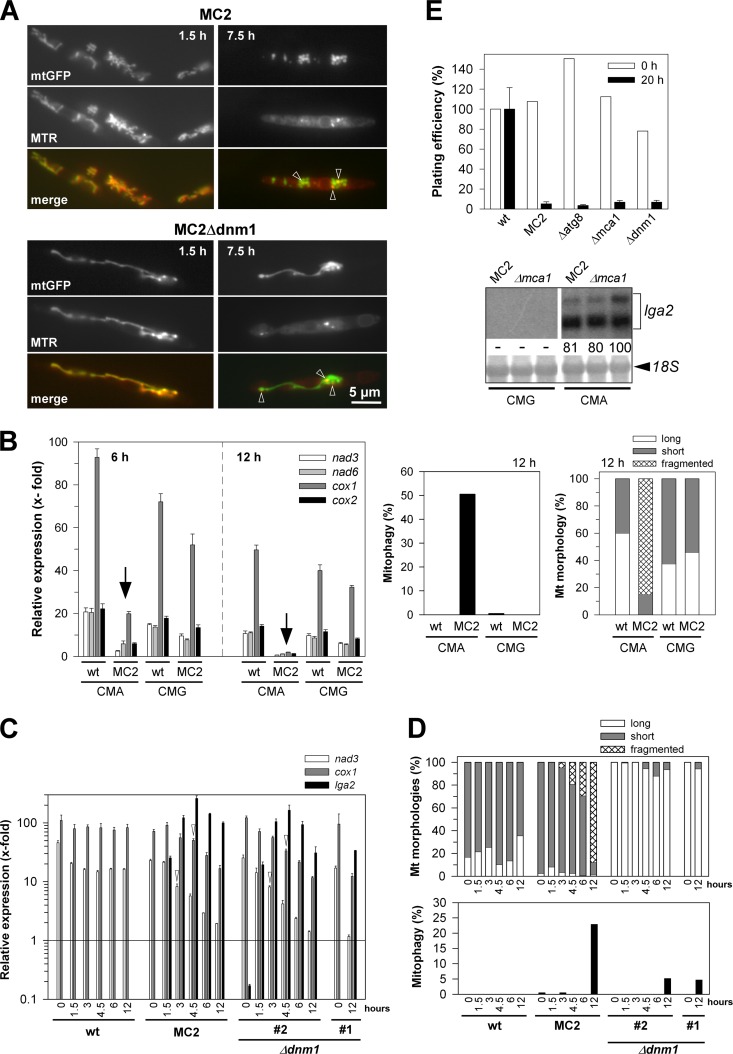
Fig 2.
Analysis of mitochondrial and cellular integrity in response to lga2 overexpression. (A) Reduction of membrane potentials. Cells were removed from cultures of strains MC2 and MC2Δdnm1 at 1.5 and 7.5 h after lga2 induction in CMA. Cells were analyzed by fluorescence microscopy to assess the colocalization between MTR and mtGFP fluorescence (see also Fig. S3 in the supplemental material). (B) Analysis of mtRNA levels in lga2-induced cells (left panel). The U. maydis strains FB2/pMB2-2 (wild type [wt]) and MC2 were transferred from CMG to either CMG or CMA to determine transcript levels of mitochondrial nad3, nad6, cox1, and cox2 genes by qRT-PCR analysis. For the 6-h time point, the starting OD600 values were 0.2 (CMG) or 0.3 (CMA), and for the 12-h time point, the OD600 values were 0.03 (CMG) or 0.1 to 0.15 (CMA). Results were normalized against the expression of the tbp gene (analyzed in each sample and set to 1.0). Given are the means ± standard deviations from four technical replicates. (Right panel) Samples were taken from the same cultures for analysis of mitophagy and mitochondrial morphologies at the 12-h time point. Values refer to the means from two independent cultures analyzed for each strain and condition (n > 100 cells/sample). (C and D) Time course analysis of lga2 effects and their dependence on dnm1. (C) The U. maydis strains FB2/pMB2-2 (wild type [wt]), MC2, and two independent MC2Δdnm1 strains (#1 and #2) were transferred from CMG to CMA to determine nad3 and cox1 transcript levels by qRT-PCR analysis. lga2 levels were analyzed for control. Results were normalized against the expression of the tbp gene (analyzed in each sample and set to 1.0). Given are the means ± standard deviations from three technical replicates. The detection threshold was set to 10−1 (relative units). (D) Samples were collected from cultures for analysis of mitochondrial morphologies (top) and mitophagy (bottom) (n > 200 cells/sample). For both panels C and D, samples from strain MC2Δdnm1#1 were collected only from the 0-h and 12-h time points for comparison. (E) Plating efficiencies were determined before (0 h) and at 20 h after lga2 induction. For the 20-h time point, calculations were from at least two experiments with ≥3 replicates per experiment, each including two independent MC2 mutant strains (means ± standard deviations). For the 0-h time point, average values of at least two replicates are indicated. Colony counts were normalized to the individual OD600 values at the time of plating and refer to the results with the wild-type strain FB2/pMB2-2 (set to 100%) for the two time points. (Bottom) Northern analysis to assess lga2 expression in two independent MC2Δmca1 strains (Δmca1) cultivated in either CMG or CMA for growth periods of 6 h. The parental MC2 strain served as a control. Methylene blue staining (18S) reflects the amounts of RNA loaded. Radioactive signals were quantified (both for lga2), with the strongest signal set to 100.

