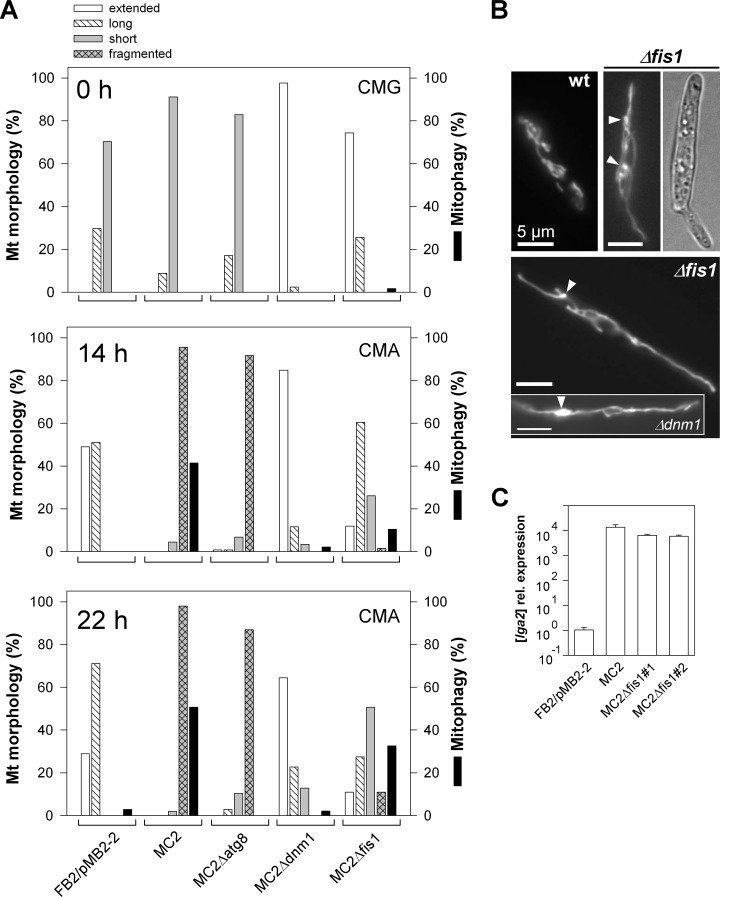
Fig 3.
Mitochondrial morphology states and mitophagy in various mutant backgrounds. (A) Cells were transferred from CMG (0 h) to CMA for growth periods of 14 and 22 h. (See Fig. 1D for classification of mitochondrial morphologies.) Extended, a net-like or single linear tubule throughout the cell. Percentages of cells displaying mitophagy are also shown. n > 100 cells/sample. One representative example of each of two independent mutants analyzed, which gave very similar results, is shown. (B) Log-phase cultures of strains FB2/pKS1 (wild type [wt]) and FB2Δfis1/pKS1 (Δfis1) in CMA were analyzed by fluorescence and DIC light microscopy. Note the formation of interconnected and bulbous structures (arrowheads) in the Δfis1 mutant, in contrast to interrupted tubules in the wild-type control. The inset shows the mitochondrial morphology of strain FB2Δdnm1/pKS1. Bars, 5 μm. (C) Verification of lga2 overexpression in Δfis1 mutants by qRT-PCR analysis. RNA was extracted from samples at 6 h after lga2 induction. Differences in transcript levels were calculated relative to those in strain FB2/pMB2-2 (set to 1.0). Data shown are the means ± standard deviations from four technical replicates.

