
Fig 4.
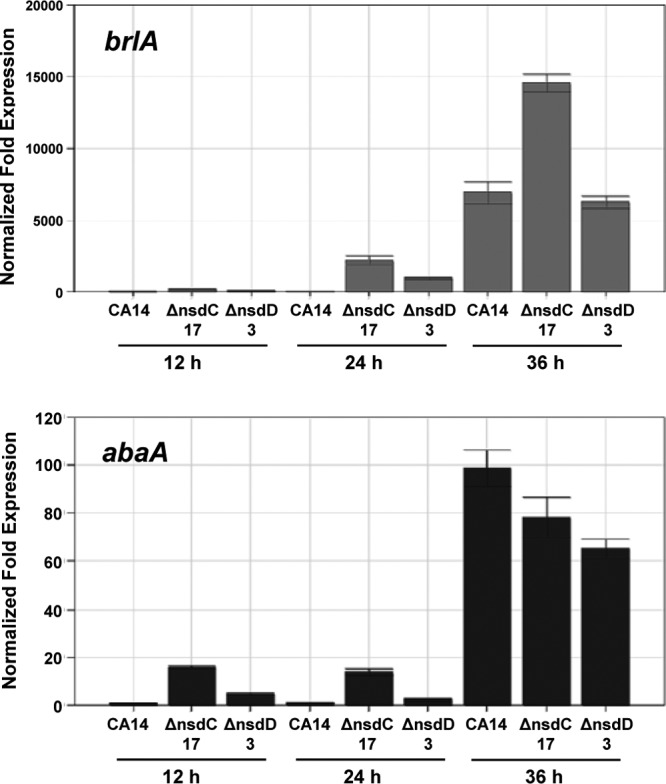
qPCR of the conidiation-specific transcription factors brlA and abaA. Gene expression levels at each time point were normalized (ΔΔCT analysis) to A. flavus 18S rRNA gene expression levels utilizing the gene expression analysis software package for the Bio-Rad iQ5.