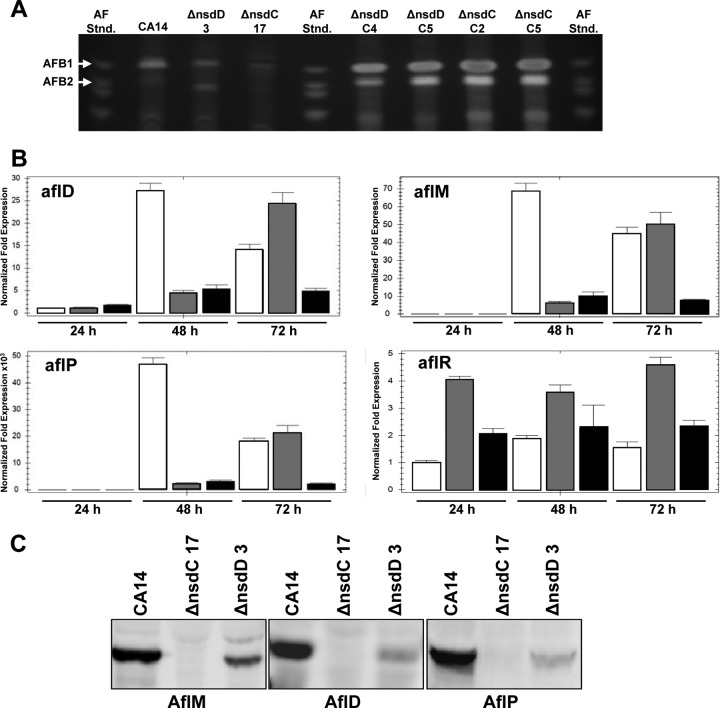
Fig 5.
Aflatoxin production and expression of aflatoxin biosynthetic genes in Δnsd mutants and Δnsd complementation strains. (A) Extracts of the wild-type CA14, ΔnsdC 17 and ΔnsdD 3 mutants, and ΔnsdC (C2 and C5) and ΔnsdD (C4 and C5) genetically complemented strains grown for 3 days on PDB-U. Extracts (5 μl) were spotted onto 250-μm silica gel TLC plates, and metabolites were separated in toluene-ethyl acetate-formic acid (5:4:1, vol/vol/vol). Aflatoxin standards were also spotted on the plate. The plates were visualized under 310-nm UV light. (B) qPCR of aflatoxin gene transcripts from 24-, 48-, and 72-h cultures. Gene expression levels at each time point were normalized (ΔΔCT analysis) to A. flavus 18S rRNA gene expression levels utilizing the gene expression analysis software package for the Bio-Rad iQ5. Bars: white, CA14; gray, ΔnsdD 3 mutant; black, ΔnsdC 17 mutant. (C) Western blot analysis of AF enzymes (AflM, AflD, and AflP) present in total protein extracts of 48-h cultures of strains grown in PDB-U shake cultures.

