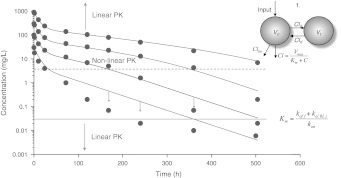
Fig. 11.
Fitting the 2-compartment Michaelis–Menten model (45) to the data of Fig. 3 which are represented by the dots. The drawn curves are predictions of the Michaelis–Menten model for the parameter values listed in Table 4. The dashed line in the middle of the plot indicates the estimated value of K M. Notice how far away it is from the original value of K m—marked by the thin drawn line—which was estimated by the TMDD model

