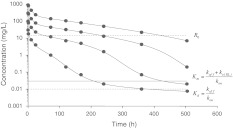
Fig. 3.
Semi-logarithmic graphs of the ligand plasma concentration versus time after the administration of four rapid intravenous injections D of 1.5, 5, 15 and 45 mg/kg, respectively (Data set (I)). The volume of the central compartment V c for these doses was fixed at 0.05 L/kg. The dots are simulated data and the solid curves are obtained by fitting the model sketched in Fig. 2 to the data. Estimates are given in Table 2

