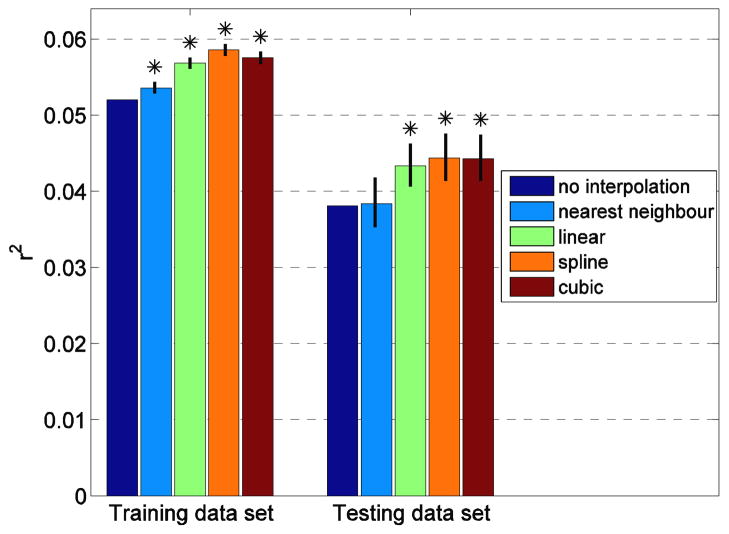
Figure 5.
Average results in term of r2 for eight users (with the multiple linear regression technique, the sliding windows approach, two electrodes and features selection), when no interpolation is used (dark blue) and for four different interpolation methods. The error bars represent the interval of confidence at 95% of the increase of the results compare to no interpolation. Except for the nearest neighbor, all the interpolation techniques significantly increase the results.

