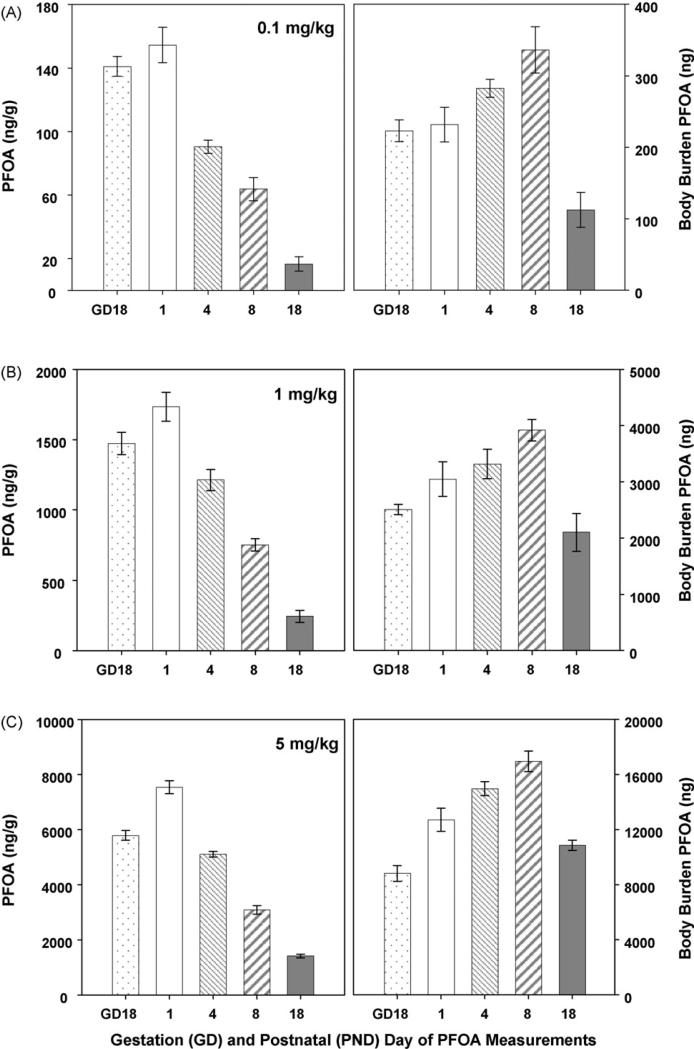
Fig. 5.
Whole pup PFOA concentrations. PFOA concentrations were measured in a representative whole pup (pup and blood; ng/g; left panels) from each litter. Although there is a consistent downward trend in PFOA concentration over time, the rapidly increasing blood volume and body weight changes must be taken into consideration when interpreting these data. Body weight-adjusted values (right panels; [ng/g PFOA measures × g body weight = body burden]) demonstrate an accumulation of exposure until late in the lactational period. Data are shown as mean ± SEM.

