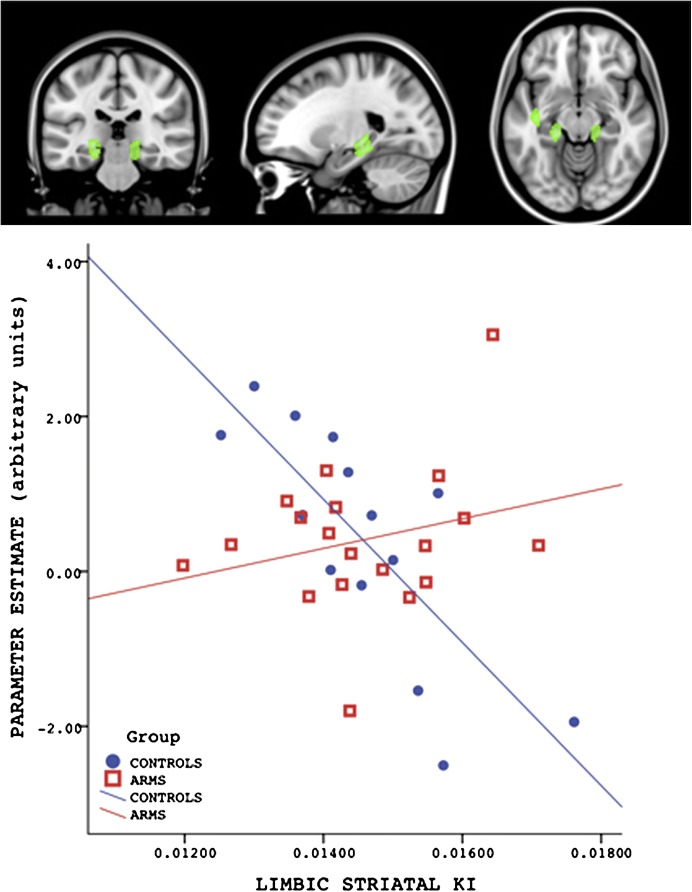
Fig. 4.
Altered relationship between MTL activation during correct recognition and striatal dopamine function. The plot shows the averaged parameter estimates across the 4 MTL clusters. There was a negative correlation between activation in the hippocampus and subiculum bilaterally and Ki for F-Dopa in the limbic striatum in the Control group (blue dots) but not in the ARMS group (red squares).

