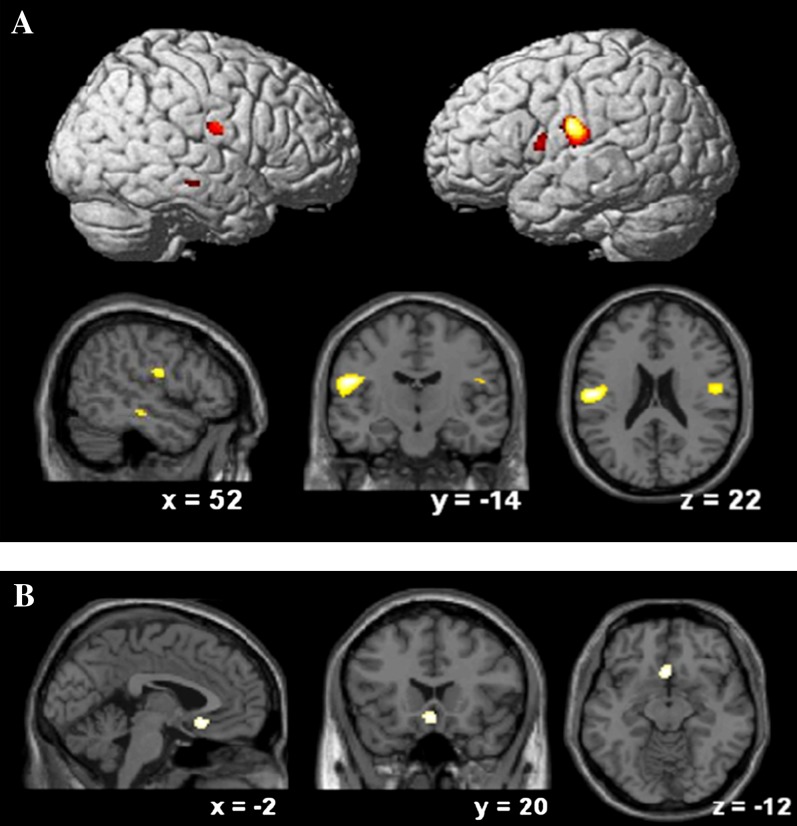
Fig. 1.
Comparison across diagnostic subgroups: A, gray matter volume reductions in UHR-SZ in comparison with UHR-NP; B, gray matter volume reductions in UHR-AFF in comparison with UHR-SZ. A threshold of P < .001 (uncorrected) was used to show the trends at uncorrected level reported in the results section.

