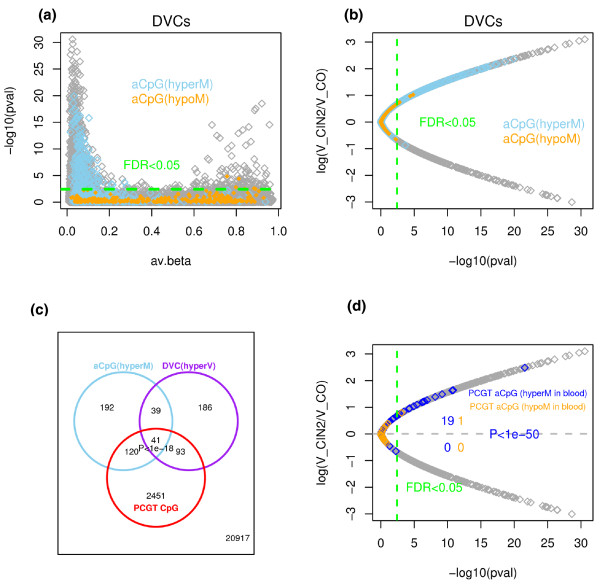
Figure 2.

Relation between differentially variable and age-associated CpGs. (a) Bartlett test P-values (on -log10 scale) of CpGs indicating significance of differential variability (between prospective CIN2+ and controls) (y-axis) versus their average β-value across all samples (x-axis). CpGs undergoing age-associated (aCpG) hypermethylation (hyperM) or hypomethylation (hypoM) are colored as indicated. (b) The ratio (on log scale) of variability in prospective CIN2+ to variability in controls (y-axis) versus significance level (x-axis). Skyblue (orange) denotes CpGs significantly hypermethylated (hypomethylated) with age (aCpGs) in normal cells from uterine cervix. The green dashed line represents the FDR cutoff value of 0.05 for calling DVCs. (c) Venn diagram illustrating overlaps of age-hypermethylated CpGs with DVCs that are hypervariable (hyperV) in prospective CIN2+, and with PCGT CpGs. A total of 41 CpGs overlapped between all three categories and 20,917 CpGs were in none of the three categories. The P-value (estimated from a multiple binomial test) indicates the random chance of observing 41 or more overlapping CpGs. (d) As (b) but now highlighting the 68 and 20 CpGs that map to PCGTs and undergo age-associated hyper- (blue) and hypomethylation (red) in whole blood samples [7]. Among these CpGs, we give the number that are significantly differentially variable (FDR < 0.05, green dashed line) and their distribution in terms of increased or decreased variance in future CIN2+ cases. P-value is from a binomial test.
