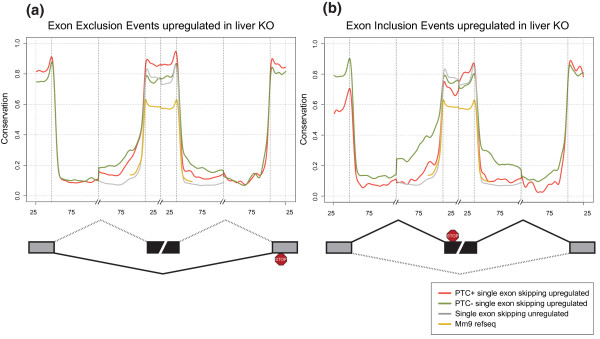
Figure 5.
Introns flanking regulated exons are highly conserved. (a, b) Mean per position phastCon conservation scores around SES events are shown for exclusion events upregulated in the KO sample (a), and for inclusion events upregulated in the KO sample (b). Shown are PTC+ exclusion/inclusion events (red line), PTC- exclusion/inclusion events (green line) and unregulated skipping events (grey line). Yellow lines are scores for all mm9 RefSeq exons and 75 bp into surrounding introns. Data shown are for liver. Exclusion events: PTC+, 439; PTC-, 251. Inclusion events: PTC+, 64; PTC-, 162. Unregulated events: 3,494. Mm9 RefSeq exons: 274,281. See Figure S4 in Additional file 10 for a graph with BMM data. Numbers on the x-axis indicate nucleotide intervals - 25 and 75 nucleotides for exons and flanking introns, respectively. Curves represent a cubic smoothing spline fitted to data.

