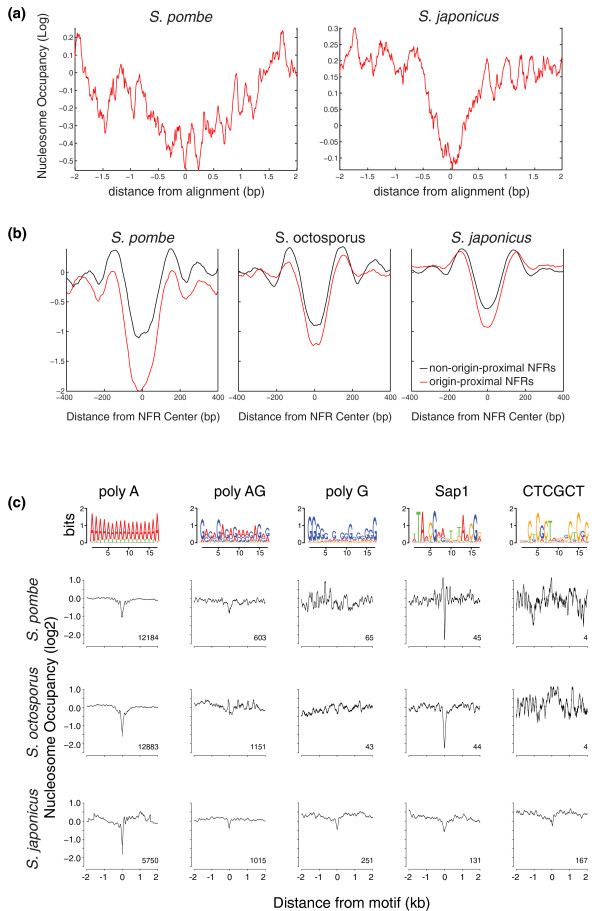
Figure 4.
Fission yeast origins are depleted of nucleosomes. (a) Average nucleosome occupancy for all replication peaks relative to the genome average is plotted log2. (b) Average nucleosome occupancy of the NFRs nearest to each replication peak is plotted in red; the nucleosome occupancy of the NFRs nearest to an equal number of random non-origin locus is plotted in black. (c) Average nucleosome occupancy over all instances of each of the identified origin motifs relative to the genome average is plotted log2. The logo for each motif is shown above.

