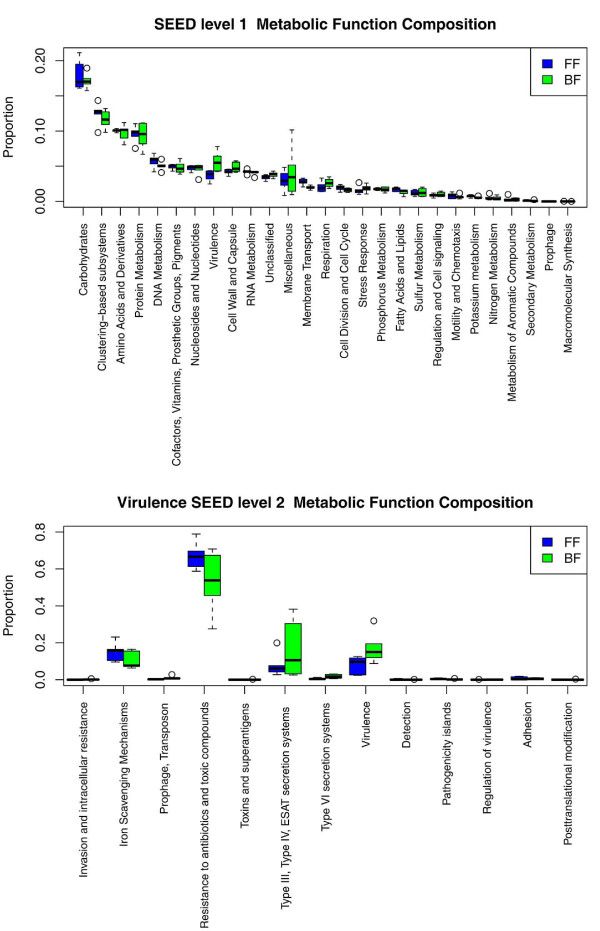
Figure 3.
Functional analysis of metagenomic data. Top panel: SEED level 1 categories for which all BF or all FF samples had at least 200 reads mapped. At least 2% of the total number of mapped reads were tested for differences between BF (breast-fed) infants (green) and FF (formula-fed) infants (blue). A permutation test on the test statistic ∑iεBF pi/6 - ∑iεFF pi/6, where iεBF and iεFF denote that sample i is BF or FF infant, respectively, and p denotes the associated taxon proportion, was performed. The FDR corrected q-value for the virulence category was 0.058. Bottom panel: differences between BF and FF infants in the SEED level 2 virulence assignment (within the SEED level 1 virulence category) was assessed using a permutation test on the test statistic ∑s |∑iεBF pis/6 - ∑iεFF pis/6|, where s indexes the SEED level 2 virulence categories, and P = 0.0140.

