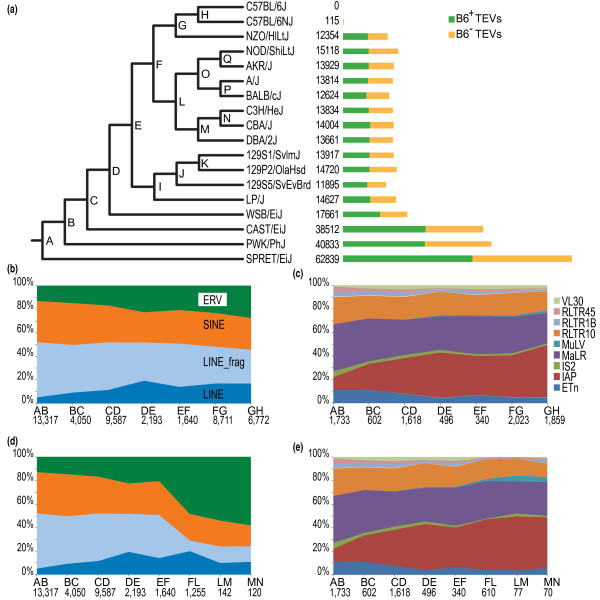
Figure 1.
Distribution of TEVs across a phylogeny representing a primary subspecies history of 18 mouse strains. (a) This phylogeny (left), which averages across these strains' known phylogenetic discordances, was imputed by considering TEVs to be discrete morphologies. All nodes were supported by bootstrap values of 100%. Numbers of B6+ and B6- TEV insertions are shown (right), within and without the C57BL/6J lineage, respectively. Unless we have evidence for the contrary, we assume that a strain's genome is identical to that of C57BL/6J. Green and yellow bars represent numbers of TEV insertions in the C57BL/6J lineage (B6+; green) and insertions outside of this lineage (B6-; yellow), respectively. The large number of TEVs in SPRET/EiJ (bottom) indicates that these are most often absent in C57BL/6J (and other lab-based strains), rather than indicating that there is a larger number of TEs in SPRET/EiJ. (b, d) Proportions of TEV classes (ERVs, LINEs and SINEs) across the inferred phylogeny for C57BL/6J (b) and C3H/HeJ (d) lineages. LINE elements are further divided into full-length insertions (> 5 kb) and smaller fragments of LINEs (LINE_frag). (c, e) Proportions of ERV families across the inferred phylogeny for C57BL/6J or C57BL/6NJ (c) and C3H/HeJ or CBA/J (e) lineages. For example, 'AB' indicates insertion events inferred to have occurred after the divergence of SPRET/EiJ from all other strains. Numbers of predicted insertions are given below.

