Figure 3.
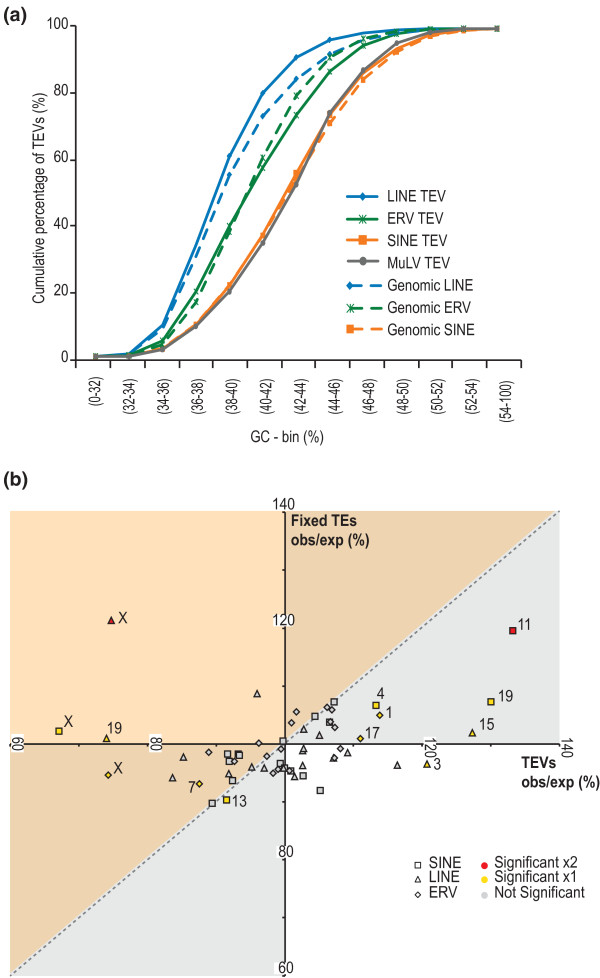
Genome-wide nucleotide composition and chromosome biases for TEV density. (a) Cumulative distributions of TEV families according to their genomic GC context. SINE TEVs tend to occur in GC-rich sequence while LINE and ERV TEVs each show an AT preference, with the notable exception of the MuLV family, which is biased towards GC. TEVs showed no differences in these biases compared to all TEs in the reference genome assembly. (b) Chromosome biases in the densities of TEVs (x-axis) and apparently fixed TEs (y-axis). Each axis represents the observed density divided by the density expected from genome-wide random samples of sequence approximately matched according to G+C content (Materials and methods). Significant density deviations from the null expectation are indicated by color for TEVs or fixed TEs (yellow) or both (red). The spread in observed densities across chromosomes is greater for TEVs compared with the older, apparently fixed, TEs. There is a general tendency for chromosomes that exhibit elevated (decreased) TE densities to also exhibit increased (lower) densities of TEVs (excluding chromosome X: SINE R2 = 0.6756, P < 10-4; LINE R2 = 0.0054, P < 0.7; ERV R2 = 0.3836, P < 0.0047). The quadrants shaded grey match this correlation in ratios between TEVs and fixed TEs. Nevertheless, this trend does not explain the higher than expected density of TEVs on the X chromosome when compared with its lower than expected TE density. All chromosomal TE density points that fall within the orange shaded area show signals of positive selection according to the McDonald-Kreitman test (FDR 0.1%).

