
Figure 3.
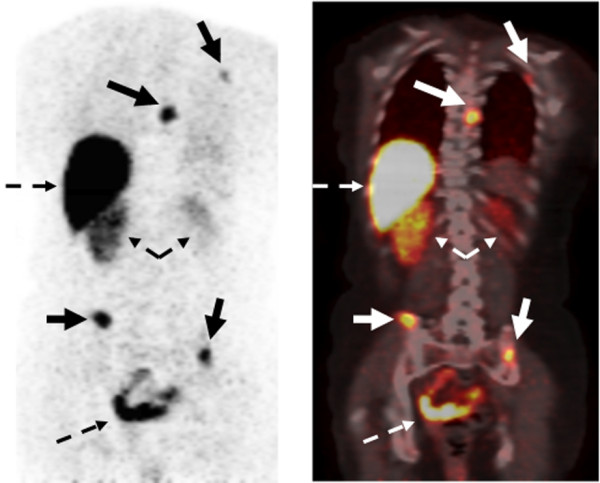
Example of 16α-[18F]-fluoro-17β-estradiol (FES) positron emission tomography (PET) imaging with 18F-fluoroestradiol. (Left) PET emission image. (Right) PET-computed tomography fusion image. In the emission image, increased tracer uptake appears dark, whereas in the fusion image, increased uptake appears white/yellow. Images show multiple sites of estrogen receptor-expressing bone metastases along with normal uptake and excretion of FES into the liver, kidneys, and bowel (dashed arrows).