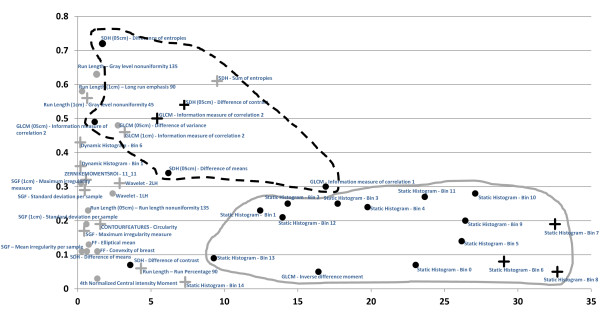
Figure 3.
Finally selected features (n = 46). Strength of risk prediction within the final logistic regression model on x-axis (absolute value of log odds ratio per standard deviation) and the feature's Spearman correlation with percentage mammographic density (PMD) on the y-axis. +The texture feature and PMD have the same direction with regard to their association with risk (that is, either positive log OR and positive correlation with PMD or negative log OR and negative correlation with PMD). •The texture feature and PMD have the opposite direction with regard to their association with risk (that is, either positive log OR and negative correlation or negative log OR and positive correlation with PMD). Gray symbols, Feature is selected in fewer than 90% of the bootstrap samples. Black symbols, It is selected in more than 90% of the bootstrap samples. The dashed line circumscribes a cluster of second-order statistical features, and the continuous gray line circumscribes a cluster of first-order statistical features. "Static histogram" refers to features describing the relative frequency of gray-level values according to a given interval (bin). These features are thus first-order statistics describing the gray-level distribution. SDH refers to features calculated from sum and difference histograms, and GLCM refers to features calculated from a gray level co-occurrence matrix. Both of these are second-order statistics, describing the gray-level distribution relative to spatial relations between adjacent pixels. SGF refers to the statistical geometric features, describing the structure of the microtexture. A more-detailed description of all of the features is given in the Methods section.

