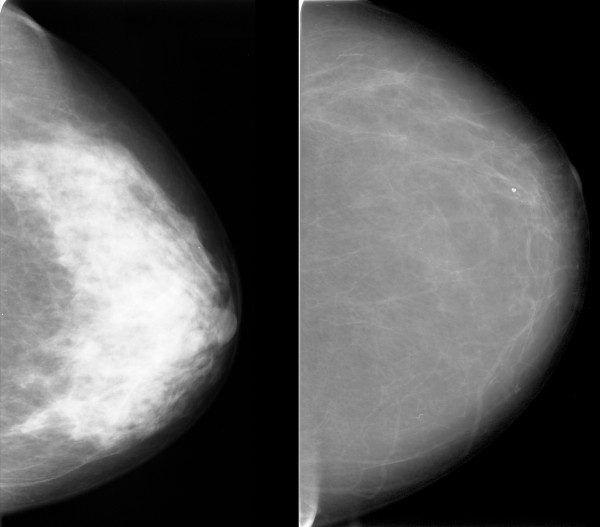
Figure 6.
Example of a feature with different directions for the correlation with breast cancer risk and PMD. Patients with mammograms like that on the left had low values for the feature "SDH (0.5 cm) difference of entropies" and had a low predicted risk of breast cancer and a high mammographic density. Patients with mammograms like that on the right had high feature values, a high risk of breast cancer, and a low mammographic density. The Spearman correlation with PMD for this feature was -0.72.

