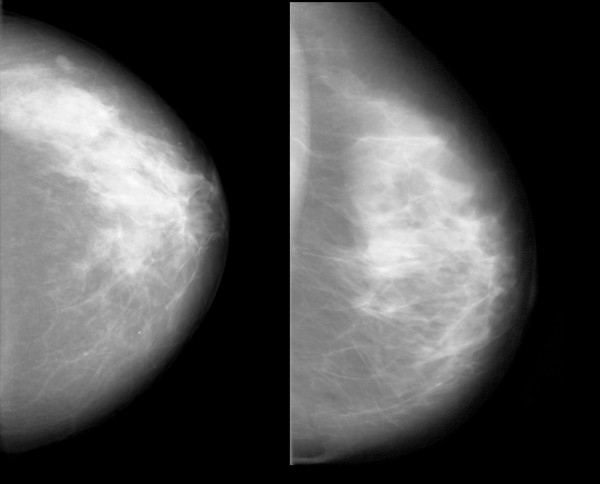
Figure 7.
Examples of images with low score values calculated with the final prediction model and a low risk of breast cancer (left), and images with high score values and a high risk of breast cancer (right). Spearman's rho for the correlation between the final score and percentage mammographic density (PMD) was 0.02.

