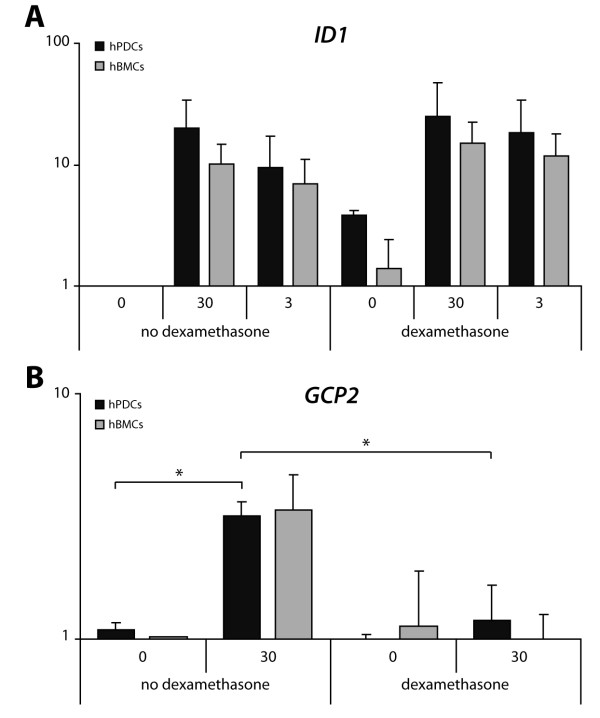
Figure 5.

Gene expression analyses of ID1 and chemokines in human periosteal and bone marrow stromal cells. Cells were cultured for 24 hours in the presence or absence of BMP2 (3 or 30 ng/ml) and 1 μM dexamethasone. Y-axis displays gene expression levels of (A) ID1 and (B) GCP2 normalized to housekeeping gene GAPDH. Values are expressed as fold increase relative to control condition (no BMP2, no dexamethasone) and are presented as log scale (n = 3; * P < 0.05). BMP2, bone morphogenetic protein 2.
