
Figure 3.
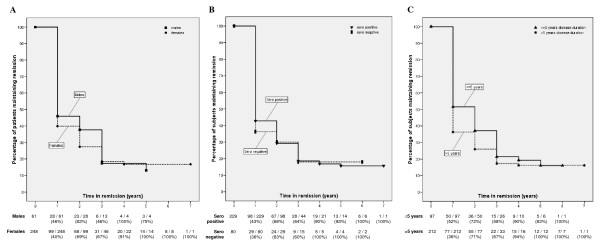
Kaplan-Meier survival curves for subjects maintaining DAS28-CRP < 2.6 remission, stratified according to (a) gender, (b) serologic status, (c) disease duration. We demonstrate the Kaplan-Meier survival curve for the percentage of patients maintaining DAS28-CRP < 2.6 remission over time. Patients are stratified according to different patient and disease characteristics. Beneath the figure, we include the number of subjects in remission and the percentage of subjects in remission compared with the total number of subjects included in the analysis at each time point.