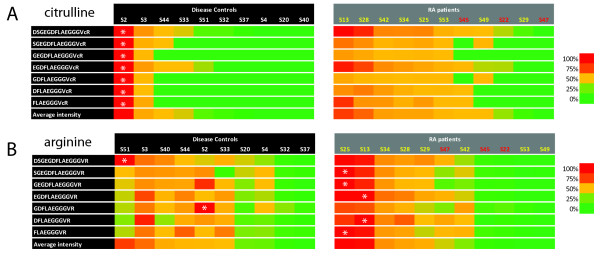
Figure 4.

Abundance of fibrinopeptide A-derived peptides in rheumatoid arthritis (RA) patients and controls. Heat map displaying the relative abundance as determined from the extracted ion chromatograms, (XIC) of citrullinated peptides (panel A) and their noncitrullinated counterparts (panel B) in RA patients and control patients. Because the abundance of different peptides cannot be directly compared due to their different behavior in the mass spectrometer, the colour coding is applied per peptide sequence, with the patient containing the highest amount of each particular peptide coloured in red, the lowest coloured in green and the other patients coloured according to the colour scale shown on the right of the panel. White asterisks indicate in which patient the highest abundance of a specific peptide was observed. For the RA patients, the code of CCP2+ patients is shown in yellow and of CCP2- patients in red. Patients are sorted according to the average abundance of all listed peptides, shown at the bottom of each panel. CCP, cyclic citrullinated peptide.
