
Figure 1.
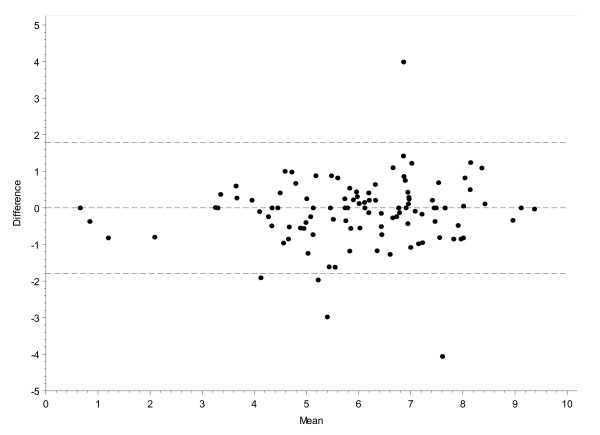
Reliability of the rheumatoid arthritis impact of disease (RAID) score shown by Bland & Altman graphic representation. *Mean of RAID score values between screening and baseline; **difference in RAID score between screening and baseline. The data lines represent the 95% confidence interval resulting in a smallest detectable change of 1.3 (for example, smallest detectable difference = 1.8).