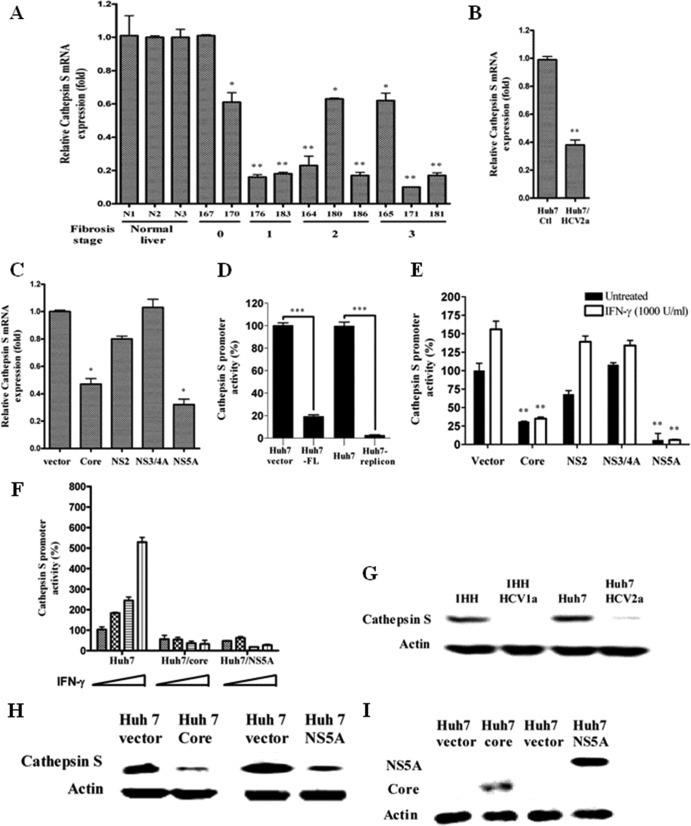
Fig 2.
HCV inhibits cathepsin S production. (A, B, and C) Real-time PCR analysis for cathepsin mRNA status in chronically HCV-infected human liver biopsy specimens, in cell culture-grown HCV-infected human hepatocytes, and in HCV gene-transfected hepatocytes, respectively. mRNA expression levels in all experimental samples were normalized with 18S RNA. (D) Huh7 cells were transiently cotransfected with a pGL3/cathepsin S promoter-luciferase construct and FL HCV genotype 1a. HCV genotype 1b subgenomic replicon-harboring cells were also used in the promoter assay. Cell lysates were analyzed for cathepsin S promoter activity after 48 h. The promoter activity (%) was compared with that of vector-transfected or control Huh7 cells arbitrarily set at 100%. The P value (***, P < 0.001) was determined by using a two-tailed t test. (E) Huh7 cells were transiently cotransfected with vector or the HCV genomic region (core, NS2, NS3/4A, or NS5A) and a pGL3/cathepsin S promoter-luciferase construct. After 24 h of transfection, the cells were treated or not with IFN-γ for 18 h and examined for luciferase activity using a firefly luciferase assay system. The P value was determined by using a two-tailed t test. (A to C and F) P values were as follows: *, P < 0.05; **, P < 0.01. (D) The P value (***) was less than 0.001 compared to normal liver biopsy samples or vector control. (F) Cells were treated with increasing doses of IFN-γ (0, 500, 1,000, and 2,000 U/ml) for 18 h after transient cotransfection with pGL3/cathepsin S promoter-luciferase construct and core or NS5A plasmid to analyze IFN-γ-induced cathepsin S promoter activity. The results are shown as the means and standard deviations from triplicate experiments. The P value was determined by one-way ANOVA (P < 0.0293). (G and H) Cathepsin S protein expression was analyzed in HCV-infected or HCV gene-transfected cells by Western blot analyses. (I) Western blot analyses for HCV core or NS5A protein expression in transfected Huh7 cells.

