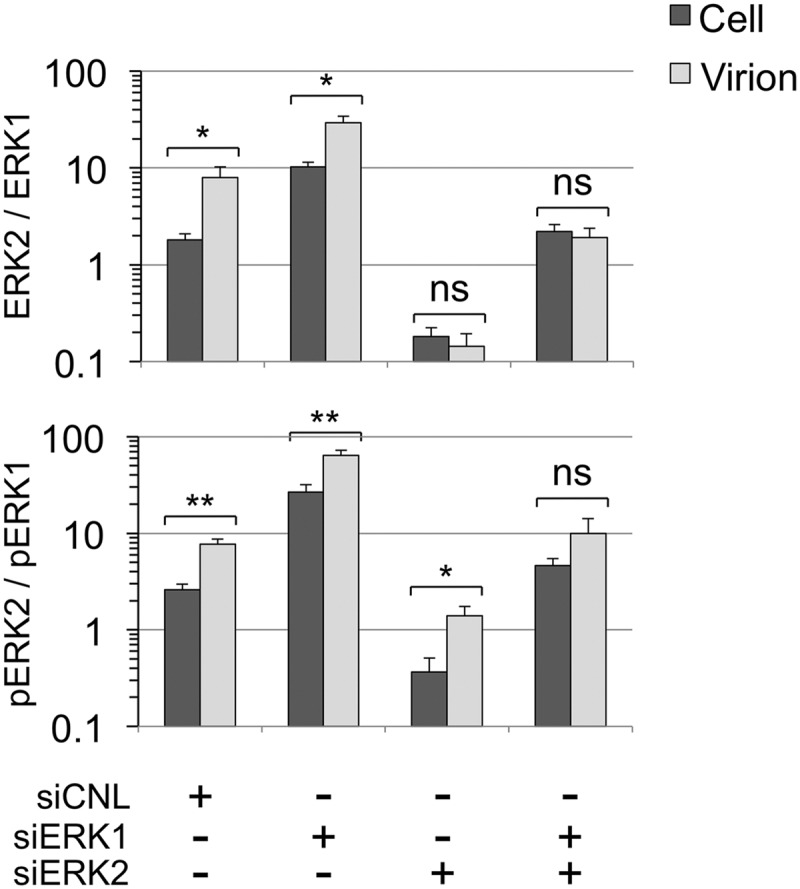
Fig 10.

Biased incorporation of ERK2 and pERK2 in RRV virion assembly. Using data from Fig. 4, 6, and 7, involving 4 independent experiments, we determined ratios of ERK2 to ERK1 (upper panel) and pERK2 to pERK1 (lower panel) in cells and virions under each of the four knockdown conditions. The results are shown graphically on a log10 scale, since the ratios differed by nearly 2 orders of magnitude. The brackets and asterisks above each pair (cell and virion) indicate the level of statistical significance of the results of comparisons of virion and cellular ratios for each indicated knockdown condition. ns, not significant. THe P values for ERK2:ERK1 were 0.0434, 0.216, 0.552 (ns), and 0.6299 (ns) for siCNL, siERK1, siERK2, and siERK1 plus siERK2, respectively. The P values for pERK2:pERK1 were 0.003, 0.0079, 0.031, and 0.1953 (ns) for siCNL, siERK1, siERK2, and siERK1 plus siERK2, respectively.
