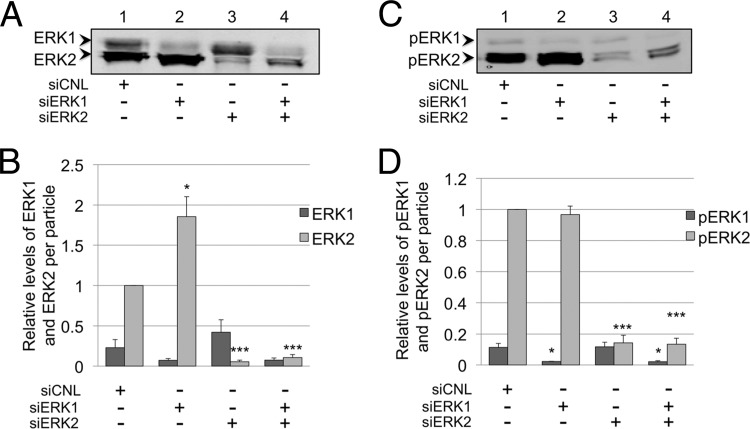
Fig 8.
Intravirion ERK content reflects intracellular expression of ERK isoforms. (A) Representative blot of virions isolated from the media of RRV-infected cells treated with siRNA (Fig. 4) and probed with anti-total ERK antibody. (B) Graphical representation of the relative levels of ERK1 and ERK2 in the viral particle, normalized to MCP for each siRNA condition (not shown). Relative values were determined using quantitative immunoblot analysis. With siERK1, the P value for ERK2 was 0.0262; with siERK2, the P value for ERK2 was 0.0001; and with siERK1 plus siERK2, the P value for ERK2 was 0.0001. (C and D) Parallel analyses performed as described for panels A and B but for virion-associated levels of pERK1 and pERK2, respectively. The data represent the means ± SEM of the results of four independent experiments. With siERK1, the P value for pERK1 was 0.0227; with siERK2, the P value for pERK2 was 0.0001; and with siERK1 plus siERK2, the P values for ERK1 and pERK2 were 0.0247 and 0.0001, respectively. Columns without asterisks indicate the lack of statistically significance difference compared to their respective controls. Values for ERK2 (B) and pERK2 (D) were set to 1.0.

