Fig 1.
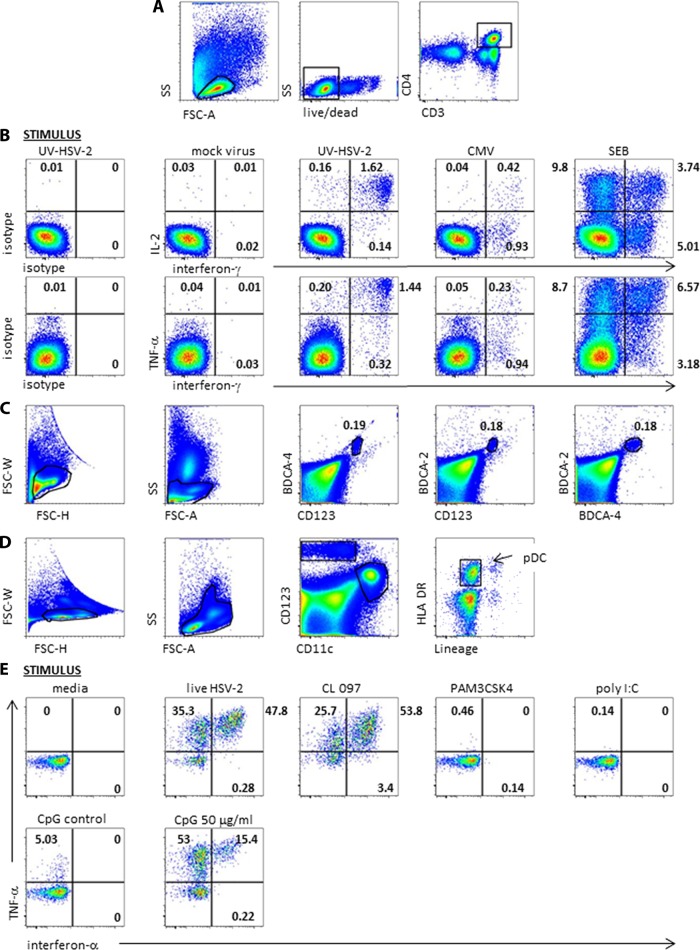
Representative flow cytometry data. (A) Gating scheme for CD4 T-cell intracellular cytokine cytometry. FSC-A, forward scatter A; SS, side scatter. Black polygons indicate gated cell subsets. (B) Responses of PBMC from an HSV-2-seropositive individual. At left, cells were stimulated with UV-HSV-2 and stained with isotype control MAb. The remaining panels show cells treated with the indicated stimuli and stained with the anticytokine MAb. The numbers are the percentages of gated CD4 T cells in the respective quadrants. (C) pDC enumeration analysis for a representative subject. Black polygons in the left 2 dotplots show cell gating. The right 3 dotplots show the percentages of gated cells positive for the indicated markers enclosed in the small polygons. (D) Gating scheme for DC ICC analyses. The third dotplot shows boxed CD123high CD11cneg cells. The fourth dotplot shows the final pDC gate of HLA-DRpos lineageneg cells. (E) Responses of gated pDC to media, live HSV-2 at MOI 100, and TLR agonists or controls. Numbers in quadrants are percentages of gated cells expressing the indicated patterns of cytokines.

