
Fig 5.
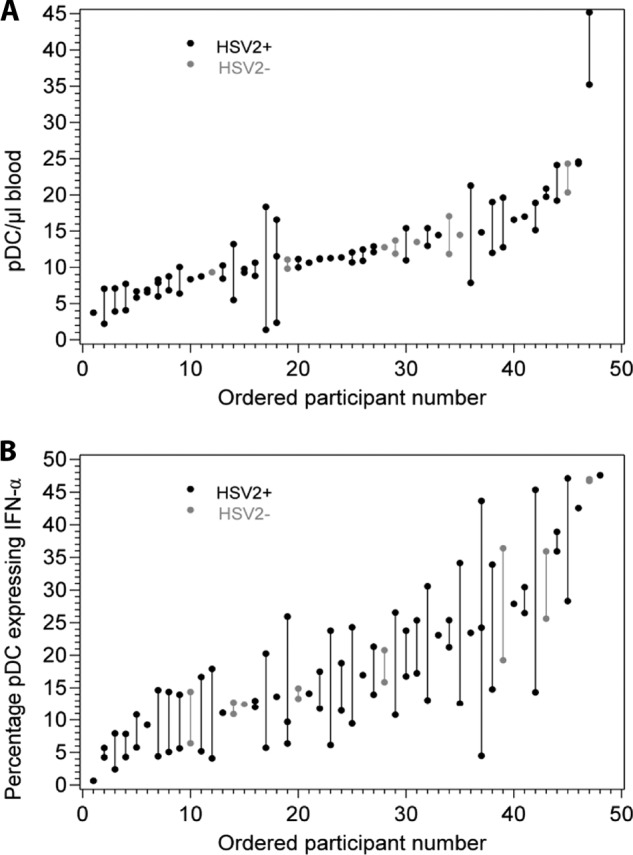
(A) Range and stability of pDC concentrations expressed as cells/μl of blood within individuals over a period of repeated sampling. Lines connect results from the same individuals. The x axis is ordered by mean cell concentration measured over 1 to 3 visits per person among 40 HSV-2-infected and 8 HSV-seronegative subjects. HSV-seronegative subjects are shown in gray. (B) Range and stability of pDC reactivity to live HSV-2 expressed as the percentage of cells expressing IFN-α in response to HSV-2 at MOI 100. Lines connect results from the same individuals. The x axis is ordered similarly to that described for panel A. HSV-seronegative subjects are shown in gray.