Fig 6.
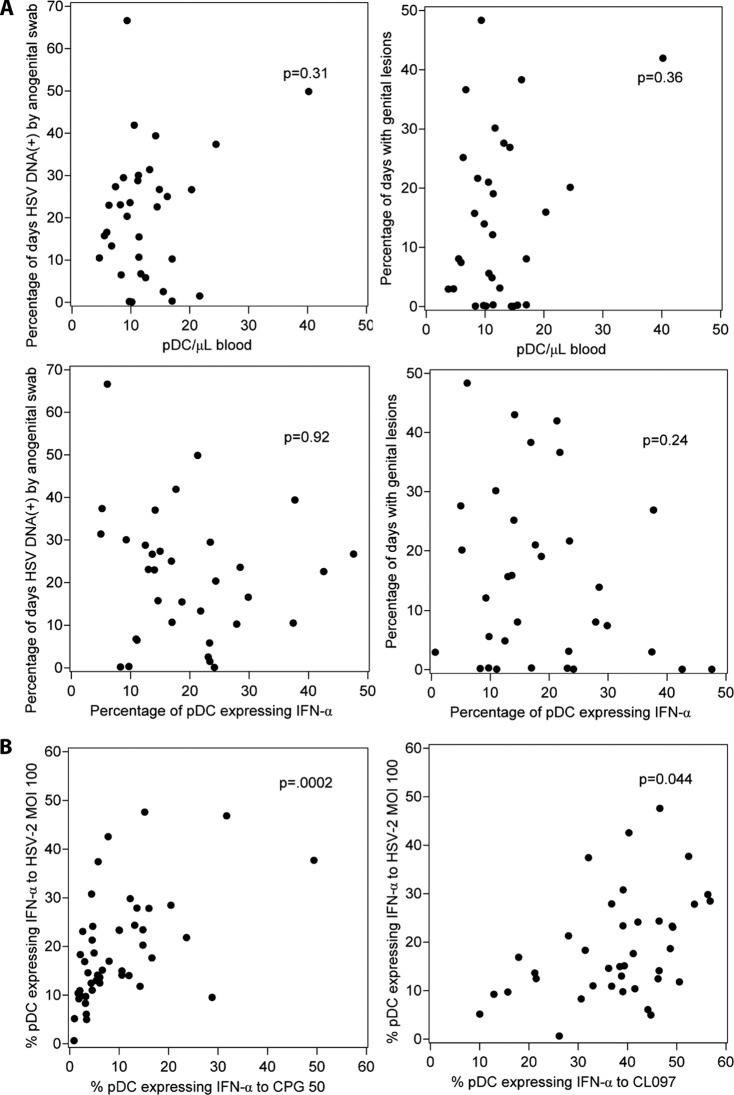
(A) Mean pDC number and function and genital herpes severity among HSV-2-infected persons. Each data point represents the average pDC data value for one person for 1 to 3 visits. The relationships between pDC number per microliter of blood and genital HSV shedding and between pDC number and genital lesion rate are shown in the upper panels. The relationships between the percentage of circulating pDC accumulating intracellular IFN-α in response to live HSV-2 at MOI 100 and genital HSV shedding and between pDC IFN-α reactivity and genital lesion rate are shown in the lower panels. (B) pDC IFN-α reactivity to HSV-2 correlates with reactivity to a synthetic TLR 9 agonist (left) but not as strongly with a synthetic agonist of TLR7 and TLR8 (right). Each data point represents the average pDC values for one person for 1 to 3 visits. HSV-2-uninfected and -infected individuals are included.

