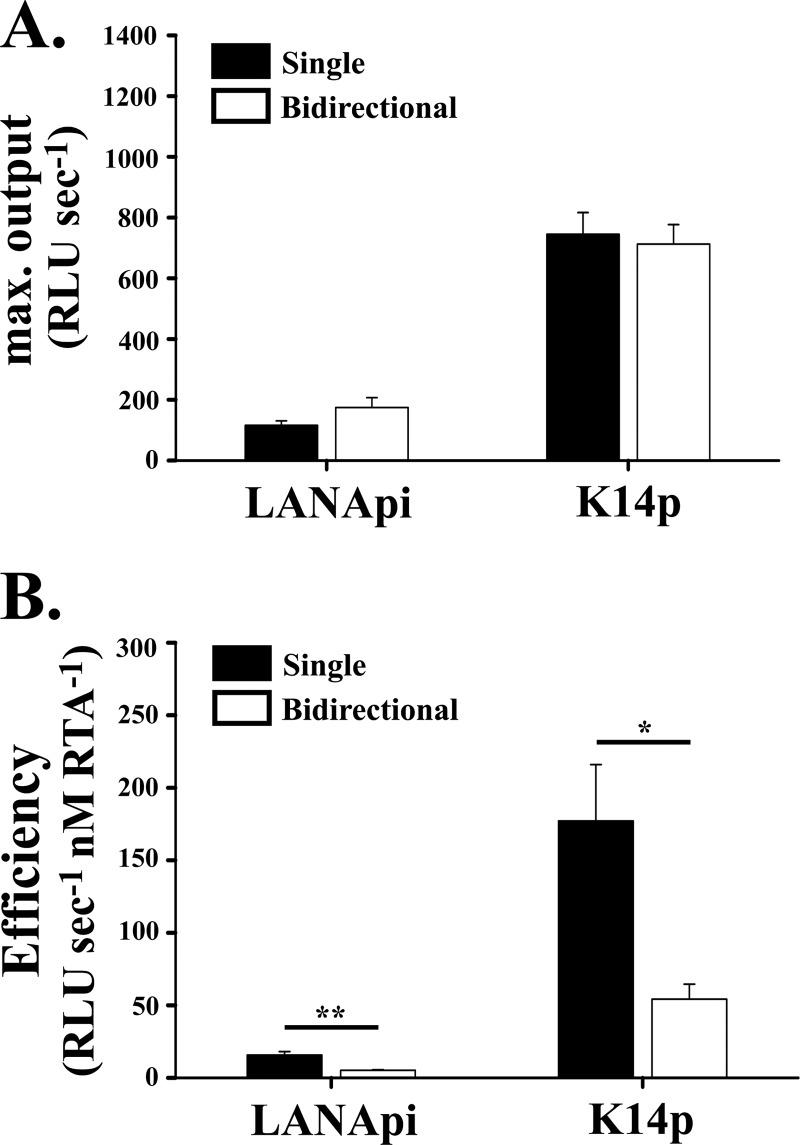
Fig 3.
RTA transactivation based on fit to noncooperative response model (Hill constant = 1). (A) The maximal output is shown for each TSS when assayed as single reporters alone (black bars) or in the bidirectional reporter (white bars). (B) The efficiency of RTA-mediated induction is shown for each TSS as single reporters (black bars) or in the bidirectional reporter (white bars). “*” indicates P ≤ 0.05; “**” indicates P ≤ 0.01. P values were determined by Student's t test.

