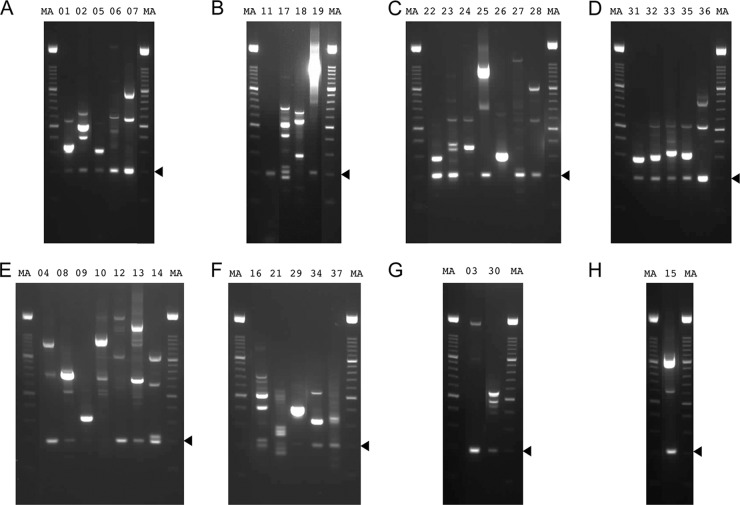
Fig 2.
RT-PCR products generated from AngHV1 splice junctions supported by >10 reads in data set S1 (set II) in the supplemental material and visualized by agarose gel electrophoresis. The lane numbers correspond to the experiments listed in Table S1 in the supplemental material. (A to D) RT-PCR was carried out under standard conditions. (E, F) RT-PCR was carried out using the same primers but under relaxed conditions. (G) RT-PCR was carried out using alternative primers under standard conditions. (H) RT-PCR was carried out under standard conditions using alternative primers, one of which spanned a dominant alternative donor site. Experiment 20 failed under all conditions tried, and data are not shown. “MA” denotes a 100-bp DNA marker ladder with major bands at 500 and 1,000 bp. The 200-bp band, which indicates the region of the gel excised for DNA sequencing, is shown by an arrowhead in each panel.

