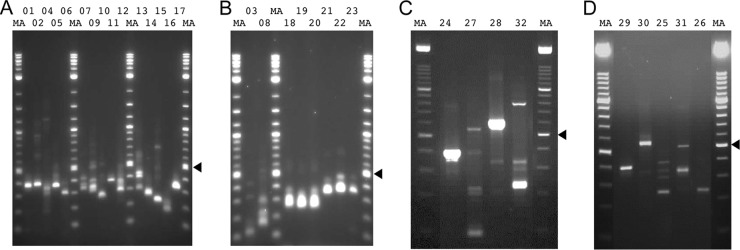
Fig 3.
RACE products generated from AngHV1 transcripts and visualized by agarose gel electrophoresis. The lane numbers correspond to the experiments listed in Table 3 and Table S2 in the supplementary material. “MA” denotes a 100-bp DNA marker ladder with major bands at 500 bp (arrowheads) and 1,000 bp. The sizes of the bands analyzed are listed in Table S2 in the supplementary material.

