
Fig 4.
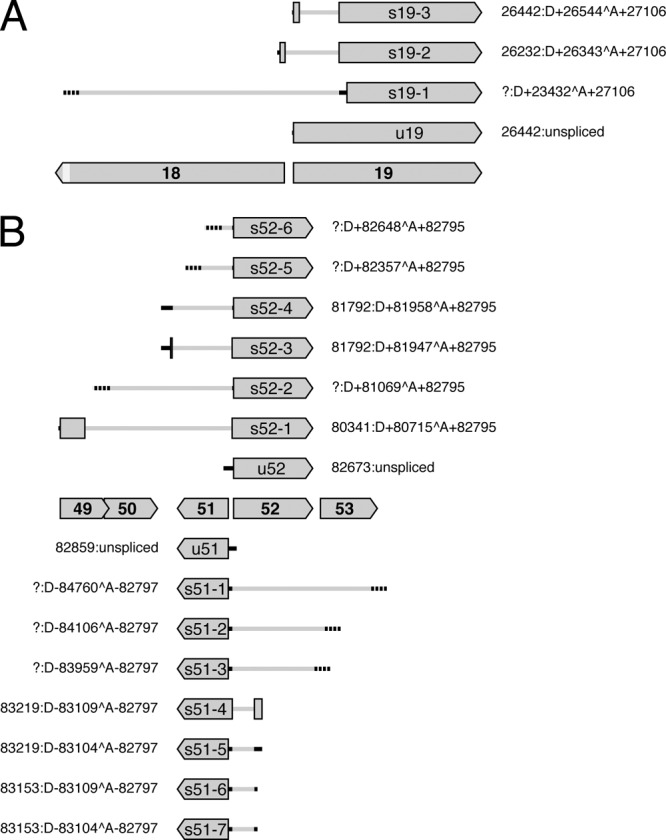
Diagram illustrating splicing patterns at the 5′ ends of ORF19 (A) and ORF51 and ORF52 (B) and their predicted effects on protein expression. Protein-coding regions are shaded gray, with names (lacking the ORF prefix) in bold type. ORF18 is shortened near its 3′ end, as depicted by the lighter gray shading. 5′ UTRs in unspliced transcripts (u19, u51, and u52) and spliced transcripts (s19-1 to s19-3, s51-1 to s51-7, and s52-1 to s52-6) are shown by solid or broken black lines, the former where 5′ ends were mapped and the latter where they were not. Introns are depicted as gray lines. Transcripts s19-2, s19-3, s51-4, s52-1, and s52-3 contain two protein-coding exons, whereas other transcripts contain one. Each set of coordinates indicates the location of the 5′ end (a question mark denotes lack of data), followed by the intron location or a description as unspliced. The 3′ regions of transcripts are not shown.