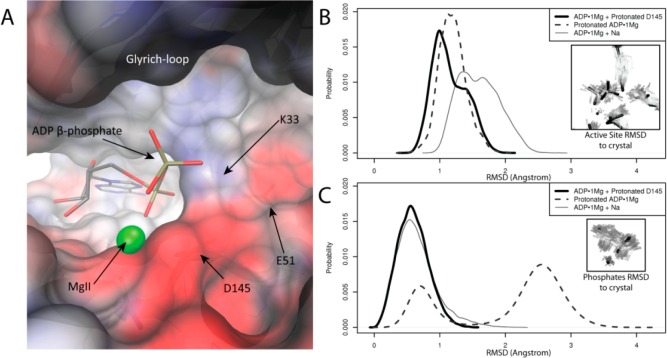
Figure 7.
Electrostatic deficit in ADP·1Mg structure. (A) pCDK2·Cyclin A active site shows strong electronegative potential around the phosphate binding region. Electrostatic potential was calculated on the apo structure (ADP, Mg2+, and ordered solvent molecules removed from ADP·1Mg structure). Surface colored from −8 (red) to 8 kbT/e– (blue). ADP and magnesium are shown for reference. β-Phosphate interaction in active site less favorable with the MgI site unoccupied. (B) MD simulation: distribution of rms deviations of phosphates, MgII, and active site residues K33 and E51 from ADP·1Mg crystal structure for each of the ADP·1Mg-type simulations. Protonation of D145 or the β-phosphate sample lowers rmsd to the crystal more than Na+ binding. (C) MD simulation: distribution of rms deviations of just phosphates and MgII from the ADP·1Mg crystal structure for each of the ADP·1Mg-type simulations. Protonation of D145 reproduces phosphate coordination in the ADP·1Mg structure better than β-phosphate protonation or Na+ binding. Mode at 2.7 Å (protonated ADP simulation) corresponds to alternate phosphate positioning and is consistent with some weak electron density from ADP·1Mg crystal.

