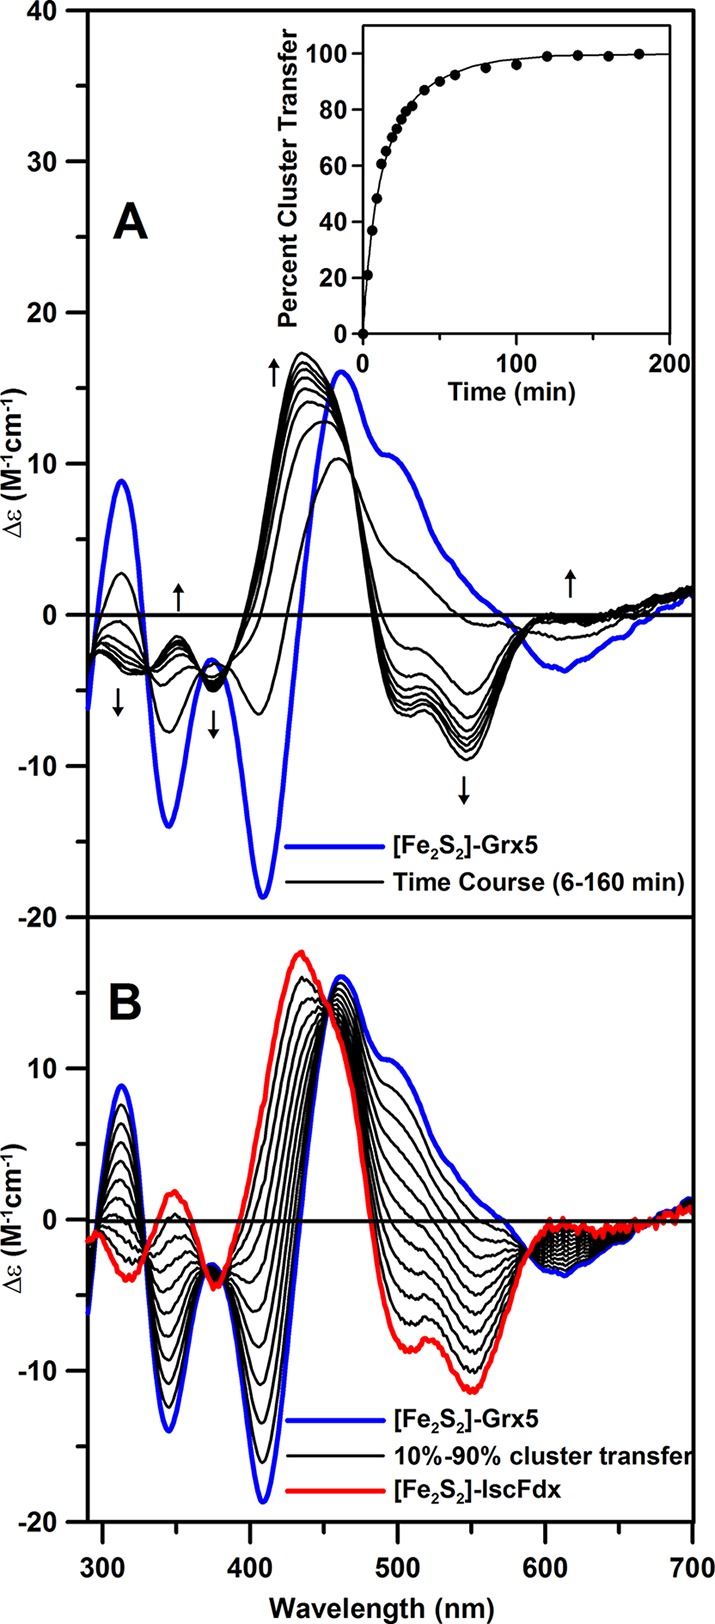
Figure 4.

Time course of cluster transfer from A. vinelandii [Fe2S2]-Grx5 (32 μM in [Fe2S2]2+ clusters) to apo-IscFdx (48 μM) monitored by UV–visible CD spectroscopy at 23 °C . (A) CD spectra recorded at 6, 20, 40, 60, 80, 100, 120, and 160 min after adding [Fe2S2]-Grx5 to apo-IscFdx in 100 mM Tris-HCl buffer, pH 7.8, with 2 mM dithiothreitol. The arrows indicate the direction of intensity change with increasing time at selected wavelengths. Inset shows kinetic data for the cluster transfer measured at 434 nm, and the solid line is a best-fit simulation to second-order kinetics with a rate constant of 2100 M–1 min–1. (B) Simulated CD spectra corresponding to quantitative [Fe2S2]2+ cluster transfer from [Fe2S2]-Grx5 to apo-IscFdx in 10% increments. Δε values are based on the [Fe2S2]2+ cluster concentration, and the path length was 1 cm.
