
Figure 3.
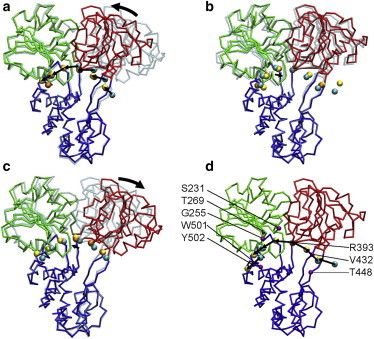
Snapshots at the beginning and end of CG simulations for the following transitions in NS3hel: (a) apo ATP transition; (b) ATP ADP-Pi transition; (c) ADP-Pi apo transition; and (d) 3-state ATP cycle (ATP ADP-Pi apo ATP). In the end conformation of NS3hel, domain 1, 2 and 3 are colored green, red and blue, respectively; the beginning conformation of NS3hel is shown as transparent; ssDNA is shown as a chain of beads located at C4¢ atoms (for ssDNA, the beginning conformation, end conformation, and target conformation are colored cyan, yellow, and orange, respectively); the movements of domain 2 and ssDNA are marked by arrows. In panel d, the residues identified as important to the translocation of NS3hel are labeled and shown as purple beads.