
Figure 4.
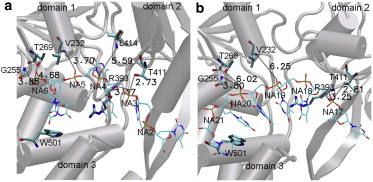
Snapshots at the end of targeted MD simulations for the following transitions in NS3hel: (a) apo→ATP transition and (b) ADP-Pi→apo transition. NS3hel, ssDNA, and selected ssDNA-binding residues (represented by cartoon, lines, and bonds, respectively). Key protein-ssDNA hydrogen bonds (dotted lines with donor-acceptor distance labeled). Lines and bonds are colored according to atom types: C (cyan), O (red), N (blue), and P (tan). The three domains of NS3hel are labeled.