
Figure 5.
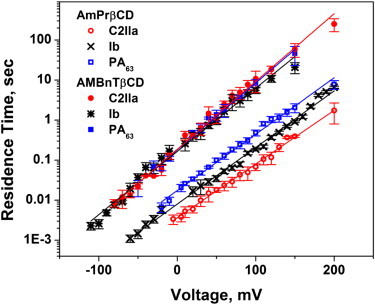
Residence times of blocker binding to the channels plotted as functions of transmembrane voltage reveal exponential voltage dependence. Membranes were bathed by 1 M KCl solution at pH 6. Blocker concentrations ranged from nanomolar to micromolar to ensure reliable statistics. Residence times were calculated from probability versus time histograms of the blockage events or by spectral analysis of current fluctuations as described previously (33). The solid lines through the data show single-exponential regression.